Quantitative Analysis
Need to know what 10,000 people think of a proposed product name? Survey. Want to know which UI widget performs better? A/B test. Curious if your site's aesthetics promote deeper dives into your content? Heat mapping. When the conditions are right quantitative analysis can settle nearly any debate.
Design teams know there's an opportunity to leverage the newly available rich engagement tracking services such as Mixpanel, Adobe's Marketing Cloud, and Optimizely for continuous experimentation. With these tools at the ready, teams must now determine which questions to ask, and how best to answer them. Ultimately when statistical relevance is necessary it boils down to large sample groups and quantitative analysis at scale but beware, you can't ask users follow-ups and correlation is not causation.
Data Is Not A Crutch
With great analytics comes great responsibility. How familiar is this scenario: a designer is absolutely positive that their new widget is far superior to the old, and a month after rolling it out into production, Google Analytics charts are all moving in the wrong direction and you're on your way to a down quarter.
My experience with both e-commerce and fintech apps has ingrained in me a roadmap of quantitative techniques that include: staged roll-outs, traffic limited features, and A/B testing to name a few. Why? Because revenue through the UX funnel in these two high traffic verticals is so easily traced and no one wants to move the needle in the wrong direction! Below I detail some of the nuances of each technique.
Luckily, when everything goes to plan Quantitative Analysis is there to prove out the theories with memorialized data. From there, it's been my job to communicate those wins to all parties.
Method
Surveys & Questionnaires
Ah, the humble survey! For NASA I helped design a survey system that had 400% higher engagement and gave rise to Chuck the NASA Squirrel. Ask me about it. While it's not rocket surgery getting it right can be a huge win. I focus on quality and longevity of data. For example: consistently keeping answers phrased negative-to-positive goes a long way to normalizing data while not stepping on the scale.
Method
A/B & Multivariate Testing
I prefer to call it the Thunderdome Method because two UI enter and one UI leaves. Interestingly, I employ A/B tests during Moderated tests where a user then has the opportunity to verbalize why they chose A versus B.
A/B Testing in production is a stakeholder favorite but often a UX Designer's nightmare. Knowing when A/B testing has become micromanagement by public firing squad can make or break the will of a design team and I'm well versed in walking this tightrope to satisfy stakeholders and team alike.
Method
Performance Analysis
Quantifying a user's time needed to perform a specific repetitive task is a frequent request by stakeholders. Over the course of multiple rounds of testing I'll often retest those tasks. At scale, Google Analytics is frequently the source of data for following users through a checkout funnel.
But beware! Dwelling on performance often pulls attention and effort away from designing delightful experiences, or worse, incentivizes deceptive UX, necessitating extra effort setting expectations with stakeholders.
More Methods
Card Sorting
Click Tracking
Eye Tracking
Heuristic Estimation
Mouse Tracking
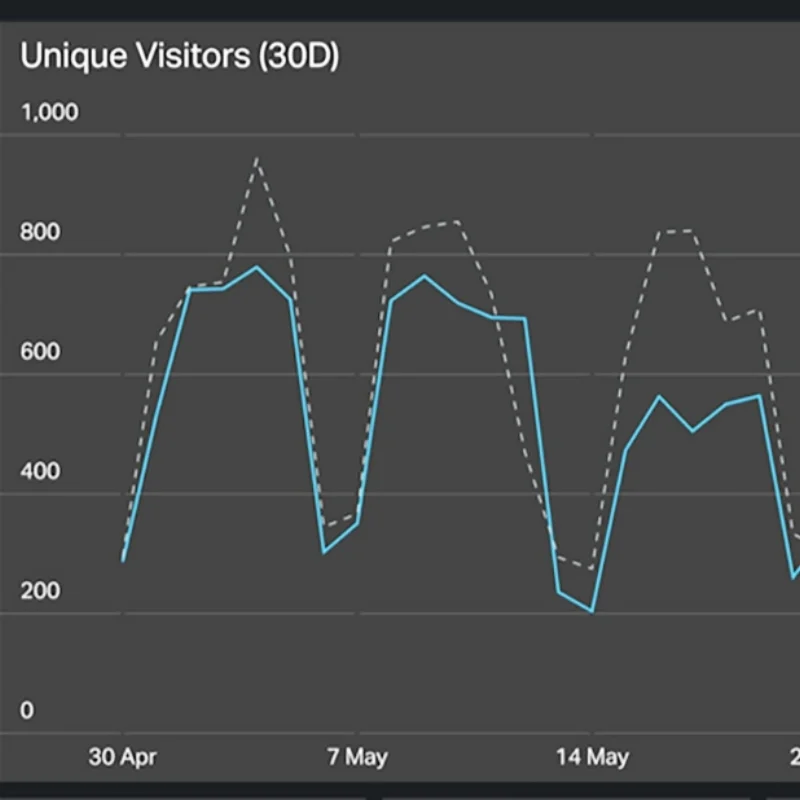
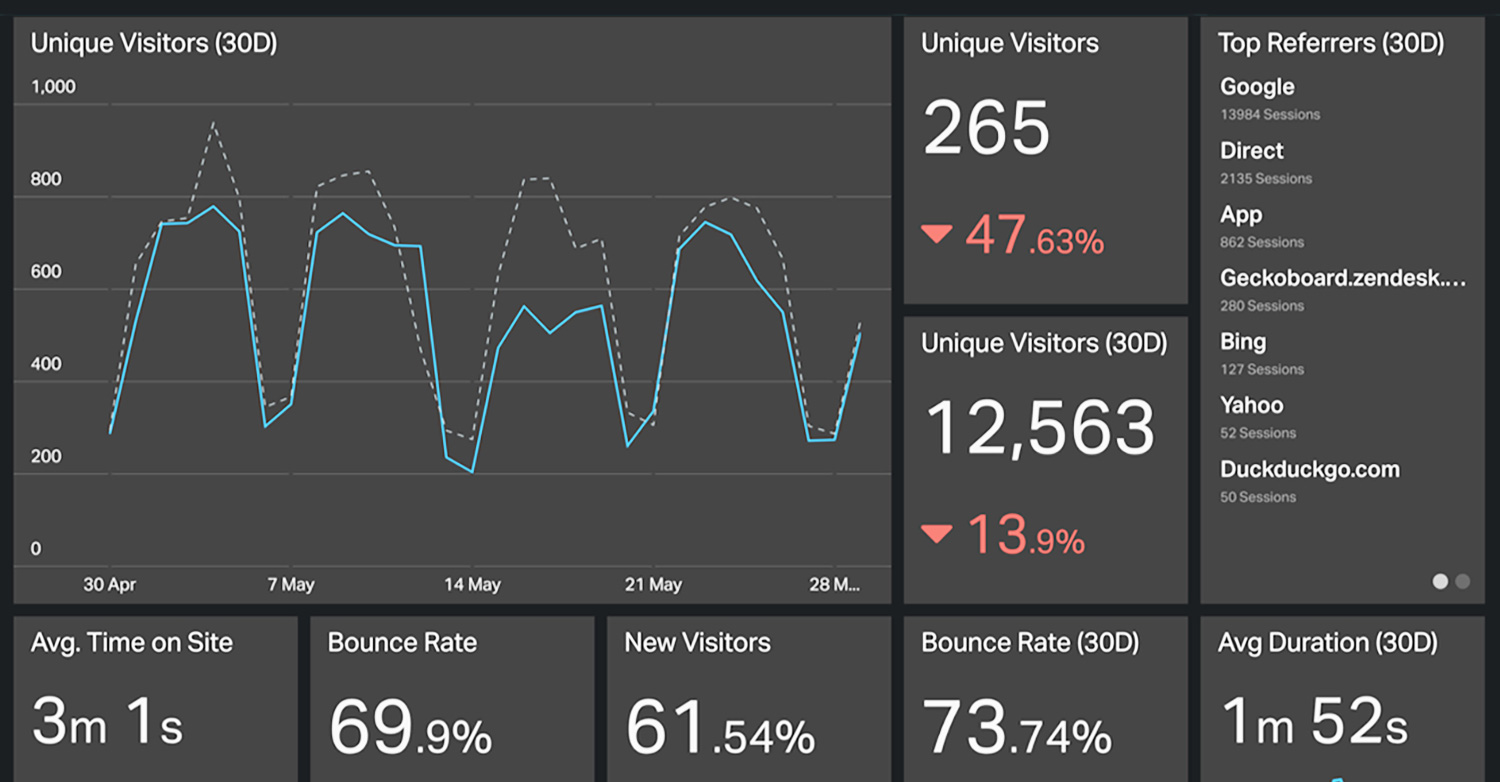
Traffic Analysis
Team I've Worked With
Half Price Books
Houston Public Library
NASA
SWBC Incorporated